
Friday, May 27, 2016
Year of Year Top Phoenix Zip Code Appreciation
These are some great numbers for the Central Phoenix neighborhood's. Coronado Historic District is crushing it right now. I predicted this almost 3 years ago in the 85006. So much so that I put my money where my mouth was and bought 2 properties here. I did underestimate the speed of the Garfield District resurgence though. What a come back this neighborhood is seeing. If you want to know where I see the next opportunity let me know : ) Again, I believe these trends to be so obvious I'm buying again this year. If you spend enough time in the research, trends and numbers it's not speculation/risk...it can actually be fun : )
Monday, May 16, 2016
West Valley Real Estate Comback
Turning our attention to the West Valley single family market, we see even more contrast between the low and high end of the market.
- Homes under $250,000 - average rise of 10.4% in $ per sq. ft. between Feb - Apr 2015 and Feb - Apr 2016
- Homes between $250,000 and $500,000 - average rise of 1.2% in $ per sq. ft.
- Homes over $500,000 - average fall of 5.0% in $ per sq. ft.
The fastest rising prices are to be found in:
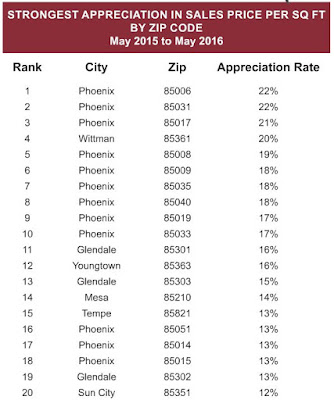
- Glendale 85301 +22.5%
- Youngtown 85363 +18.8%
- Tolleson 85353 +15.7%
- Sun City 85351 +15.3%
- Glendale 85303 +14.1%
- Glendale 85302 +12.1%
- Buckeye 85326 +11.6%
- Peoria 85345 +11.3%
- Laveen 85339 +11.2%
The weakest places for appreciation are:
- Glendale 85310 -1.1%
- Peoria 85381 +0.9%
- Peoria 85383 +3.2%
- Surprise 85374 +3.8%
All other areas are over 5%
Friday, May 13, 2016
Good News for Valley Seller
This week the Cromford® Market Index table for the single family markets in the 17 largest cities is looking better for sellers everywhere except Cave Creek:

I admit that the change in Phoenix is also negative for sellers, but a change of less than 2% is hardly statistically significant. The West Valley is still improving fastest with most of the big movers located west of I-17:
- Buckeye +17%
- Peoria +8%
- Avondale +7%
- Goodyear +7%
Sellers in Paradise Valley and Fountain Hills get some relief at last from the discouraging trends of the past several month, and Queen Creek continues its improving trend.
__________________________
The CMI (Cromford Market Index) is an algorithm (formula) that tends to be an accurate short term market predictor. It essentially looks at the relative balance between supply and demand, though there's more that goes into it.
An index score of 100 = a relatively balanced market in terms of supply and demand.
Over 100 indicates demand exceeding supply, good for sellers.
Under 100 indicates supply exceeding demand, good for buyers.
A green button shows the arrow trend is favoring sellers.
A red button shows the arrow trend is favoring buyers.
Keep in mind the obvious - the most favorable trends - where demand is exceeding supply, are in the low to mid range priced areas.
The higher-end areas, most specifically, the NE Valley, are generally not lacking in demand so much as having a year-over-year supply (new listings) exceeding demand (new contracts).
The slightly improving trend in most of the NE Valley cities is the encouraging word.
Thursday, May 5, 2016
Your City Appreciation Update 5.5.2016
As appreciation rates have declined from the huge numbers (both negative and positive) during the disruptive period of 2003-2013, it has become more obvious that our usual method for calculating appreciation is less useful for smaller segments of the market. Our method has been to take the monthly average price per square foot and compare it with the same measurement one year earlier. This works quite well for the entire market but as you break the market into smaller segments, the volatility in their monthly average $/SF become excessive. Therefore we are changing our method to use the annual average $/SF instead of the monthly average to measure appreciation for all segments of the market. We will still use our original method for measuring the entire market (all areas & types).
Using the new method here is a ranking of the cities by appreciation rate, based on the 12 month change in their annual average $/SF for single family detached homes.
- Tonopah 27.0%
- Wittmann 19.7%
- Youngtown 16.3%
- Tolleson 10.8%
- Eloy 10.7%
- Sun City 10.5%
- El Mirage 9.8%
- Glendale 9.8%
- Avondale 8.7%
- Waddell 8.2%
- Laveen 8.1%
- Florence 7.8%
- Tempe 7.8%
- Buckeye 7.5%
- Arizona City 7.4%
- New River 7.4%
- Phoenix 7.3%
- Maricopa 7.2%
- Coolidge 7.1%
- Queen Creek 7.0%
- Mesa 6.6%
- Sun City West 6.4%
- Surprise 6.4%
- Apache Junction 6.3%
- Anthem 5.7%
- Chandler 5.5%
- Peoria 4.8%
- Gilbert 4.7%
- Desert Hills 4.7%
- Goodyear 4.4%
- Wickenburg 4.4%
- Litchfield Park 3.4%
- Sun Lakes 2.9%
- Casa Grande 1.6%
- Scottsdale 1.4%
- Carefree 1.3%
- Fountain Hills 0.5%
- Cave Creek -0.5%
- Rio Verde -0.5%
- Paradise Valley -0.7%
- Gold Canyon -3.9%
We note that 10 out of the top 11 cities are in the West Valley. The lone exception is Eloy, where prices are being helped a lot by new home sales in the Active Adult community Robson Ranch. Prices in Robson Ranch are much higher than the average home with a postal address in Eloy
6 out of the bottom 7 cities are in the Northeast Valley. In fact all of the northeastern cities are in the bottom 7. This underscores how badly the luxury market has been affected by excessive supply. If you were to remove all sales over $500,000 you would get a different picture of the Northeast Valley:
- Paradise Valley 26.1% (but only 3 sales a year were under $500,000)
- Carefree 8.5%
- Scottsdale 5.5%
- Fountain Hills 4.6%
- Cave Creek 1.0%
- Rio Verde 0.0%
We can disregard the Paradise Valley number since there is almost no market in PV under $500,000. The appreciation numbers for Carefree, Scottsdale and Fountain Hills are perfectly respectable for the market under $500,000. However Cave Creek & Rio Verde seem to be stuck in neutral even for the lower price ranges. Gold Canyon is also neutral at 0.3% if we exclude homes over $500,000, but as with Cave Creek & Rio Verde, neutral is better than the negative appreciation we see when we include all homes.
All the above numbers are based on ARMLS closings, not total recorded deeds.
Wednesday, May 4, 2016
Are Millennial's Buying Homes?
Ellie Mae has introduced what they call their "Millennial Tracker™" , which provides some statistics about mortgages closed by millennial borrowers (born 1980-1999). For the Phoenix metro area, they report that:
- millennials comprise 26% of all borrowers
- 45% of millennial borrowers were married
- average age was 29
- average loan amount was $195,966
- 85% of loans were for purchase and 15% for refinancing
- 52% of loans were conventional with 47% FHA and 1% VA
- average loan took 45 days to close
- average FICO score for successful borrower was 716
- average appraised value was $225,199
- average loan-to-value was 89%
In the Tucson metro area, only 22% of borrowers were millennials.
Across the country the percentage of borrowers who were millennials varied from lows of 10% (Sarasota FL and Myrtle Beach SC) to 45% (Laredo TX). The northeast and mid west has the highest percentage of millennial borrowers. Most of California has low percentages, probably because of extremely high prices. For example San Francisco is 16%, Los Angeles 16% and San Diego 17%.
All this data relates to the first quarter of 2016.
Subscribe to:
Comments (Atom)