Tuesday, November 22, 2016

Nice Market Trending - Demand


Cromford Daily Observation - For anyone who wants to see a positive signal in demand, take a look at the daily chart for annual sales:
Ignore the short term zigs and zags and focus on the distinct change in the slope from mid October onwards. This is because 2016 has been stronger than 2015 for sales closed since mid October


Kindest regards,

Tuesday, November 8, 2016

Interesting trends in real estate...the single life.

While the data below is from the Valley (as is pretty much all Cromford Report data), the trend is national, so I'm distributing statewide. 
Cromford Daily Observation - Several reports have suggested that single female buyers are becoming a larger part of the housing market. This is one of the few demographic subjects where we have good data. When we examine deeds and affidavits of value, we cannot tell the age, race, religion, sexual preferences or much else about the buyer and seller. However we can tell if the property is being purchased by an unmarried, divorced or married man, unmarried, divorced or married woman or a married or unmarried couple, of whatever combination of sexes. These facts are mentioned right there in the wording of the deed. These days it is no longer valid to assume that a married couple is of opposite sex, but statistically speaking the numbers of same sex couples making home purchases is still small.
So can we see any trends in the numbers for Maricopa and Pinal counties? We decided to exclude distressed sales and focus only on normal sales, new homes and the flip part of a fix and flip.
1. The percentage of sales to single women, or married women purchasing as their sole and separate property has indeed increased as follows:
  • 2011 - 22.5% of all purchases
  • 2012 - 22.6%
  • 2013 - 22.7%
  • 2014 - 23.5%
  • 2015 - 24.0%
  • 2016 - 24.8% (to the end of September)
2. The percentage of sales to single men, or married men purchasing as their sole and separate property has also increased:
  • 2011 - 32.3%
  • 2012 - 33.7%
  • 2013 - 34.4%
  • 2014 - 34.2%
  • 2015 - 34.9%
  • 2016 - 34.9%
The growth for single men seems to have stalled since 2013 however, which is when the growth in single women buyers started to grow. There is a slightly faster growth for single women over single men, but it is not dramatically different. I would conclude that the reports about increasing numbers of single female buyers are valid.
3. The percentage of sales to couples has declined as follows:
  • 2011 - 45.2%
  • 2012 - 43.8%
  • 2013 - 43.0%
  • 2014 - 42.4%
  • 2015 - 41.1%
  • 2016 - 40.2%
This is a clear trend. Sales to couples remain the largest sector, but it is in a steep declining trend. This corresponds to a decline in birth rates that we have already commented on.
Another trend we observed is that couples with the wife mentioned first increased from 2.5% to 3.7% of purchases. Couples with the husband mentioned first dropped from 42.7% to 36.6%. Not quite sure what that tells us, but I am sure Cromford Report subscribers will have some interesting theories.
Two last points worth discussing, which is not mentioned, is the age of these single individuals.  I wouldn't jump to the conclusion that this is solely a younger generation putting off marriage.  We are also seeing a large increase in divorced and widowed buyers not remarrying prior to a new purchase.  The digital age has allowed these older generations to connect on a social level much easier, thus by passing the old mindset of needing a partner.  Even if coupled it is very common to see the baby boomers remain unmarried despite living their lives as such.
Now, the trillon dollar question is two fold.  Will this continue and will the millennials come full circle and flock to suburbia once they realize carrying a car seat, groceries and kids up the stairs of their urban lofts is no longer conducive to their needs as a family.  The delay of parenting hasn't yet answered whether the actual preferences of parents has changed including backyards, quality schools and safer neighborhoods.  Time will tell.... 
My prediction? Over the short term (10 years) and on a macro scale we will see a massive constriction of growth to a select few cities with low cost of living, tech hub's and public transit i.e. Portland, Phoenix etc.  On a micro level all cities will see an increase in renter demand, smaller sq/ft homes, urban concentration, decrease demand for large homes and golf course communities.  In the long term (10+ years) I believe millennials will slowly begin to start families and their lifestyles will change.  The coffee shops, art galleries and loft lifestyles will be changed in for suburban back yards, safer neighborhoods, better schools and single story homes. 
Remember what you were "in to" 10 years ago?  I would imagine it has changed drastically since then.  Millennials grow tired of routine and stagnation.  To think this lifestyle will be trending in a decade is short sighted in my opinion.
Until next time...

Wednesday, September 28, 2016

AZ Real Estate Market Update - Appreciation #'s vs. Other Cities

It is the time of the month for the S&P/Case-Shiller® Home Price Index® numbers and this month's release covers sales between May and July 2016. Month over month changes look like this:
  1. Portland +1.16%
  2. Chicago +0.92%
  3. Denver +0.89%
  4. Detroit +0.83%
  5. Phoenix +0.78%
  6. Tampa +0.73%
  7. Dallas +0.68%
  8. San Diego +0.65%
  9. Boston +0.64%
  10. Minneapolis +0.64%
  11. Los Angeles +0.58%
  12. Seattle +0.56%
  13. New York +0.55%
  14. Las Vegas +0.52%
  15. Cleveland +0.50%
  16. Miami +0.41%
  17. Atlanta +0.39%
  18. Washington DC +0.37%
  19. Charlotte +0.35%
  20. San Francisco -0.02%
Phoenix is much higher up this list than it has been for many months. Portland and Denver continue their very strong run, while Chicago and Detroit have improved to join them. Seattle and San Francisco are showing unexpected weakness compared with the recent past.
The year over year table looks like this:
  1. Portland +12.40%
  2. Seattle +11.19%
  3. Denver +9.42%
  4. Dallas +8.33%
  5. Tampa +7.76%
  6. Miami +7.05%
  7. San Diego +6.03%
  8. San Francisco +6.01%
  9. Los Angeles +5.50%
  10. Las Vegas +5.39%
  11. Detroit +5.34%
  12. Charlotte +5.33%
  13. Atlanta +5.28%
  14. Phoenix +5.19%
  15. Minneapolis +4.99%
  16. Boston +4.20%
  17. Chicago +3.71%
  18. Cleveland +2.45%
  19. Washington DC +2.02%
  20. New York +1.74%
Phoenix is looking less impressive in this longer term view. Portland, Seattle and Denver are the top three as usual. These are all primary destinations for millennials.
____________________________
So why Portland, Seattle and Denver? If you Google the question you find that there is a well-documented and discussed trend over the last several years of millenials targeting 'mid-size' cities they consider 'hip' places to live and where they would like to work.
I suppose the local equivalent in the Valley might be Arcadia, for those who can afford it. 
I wonder if our local chamber of commerce and other associations in the business of attracting (young) people to Arizona cities are paying attention to this - the opportunity to 'market' the amazing lifestyle appeal are fair cities, especially for those who would prefer the sun over cloudy Portland and Seattle (from one who traded 320 days of overcast for 320 days of sun with eyes wide open) and the frigid mile-high city. What am I missing?

Wednesday, September 21, 2016

September AZ Housing Update : )

Market Summary for the Beginning of September
Just as we predicted last month, August was a very robust month for sales, up almost 14% from August last year in stark contrast to the uninspiring numbers in July (down over 3% from July 2015). We have already seen countless headlines about weak sales in July and no doubt we will see as many stories about the very strong recovery in August once the numbers are widely distributed.
However all these headline serve to do is illustrate that reporters (and even some real estate analysts) have a hard time properly understanding the effect of the Gregorian calendar on monthly real estate numbers.
  • July 2015 had 22 working days
  • July 2016 had 20 working days (10% fewer)
  • August 2015 had 21 working days
  • August 2016 had 23 working days (10% more)
All the variation in monthly sales counts in July & August are due to the above facts and had nothing to do with conditions in the real estate market which remained very similar throughout the period. It is amusing to see all the analysts trying to explain the July numbers with "low inventory" and "poor affordability" the favorite excuses. Nope. The correct reason was "there was a weekend at both ends of July". It will be interesting to see what explanations are used for the August bounce, because inventory has moved lower still and affordability did not improve at all.
If we combined July and August in both 2015 and 2016 we get 43 working days in both years and the numbers match properly again. Then we see that the two month sales count rose 4.6% over last year. We have been seeing a similar volume improvement in the ARMLS numbers all year. Nothing unusual has gone on in July or August. However sales have increased much more than this among new homes, just as they have all year. New homes are poorly represented among ARMLS listings since about 90% of them sell outside of ARMLS. In public recordings however, we are seeing new home growth rates far in excess of the growth rates for re-sale homes.
Anyway, here are the basic ARMLS numbers for September 1, 2016 relative to September 1, 2015 for all areas & types:
  • Active Listings (excluding UCB): 19,186 versus 19,101 last year - up 0.4% - but down 2.7% from 19,711 last month
  • Active Listings (including UCB): 23,173 versus 22,413 last year - up 3.4% - but down 2.6% compared with 23,801 last month
  • Pending Listings: 6,331 versus 6,259 last year - up 1.2% - but down 7.0% from 6,824 last month
  • Under Contract Listings (including Pending, CCBS & UCB): 10,318 versus 9,571 last year - up 7.8% - but down 5.3% from 10,897 last month
  • Monthly Sales: 7,993 versus 7,031 last year - up 13.7% - and up 2.9% from 7,771 last month
  • Monthly Average Sales Price per Sq. Ft.: $138.95 versus $132.33 last year - up 5.0% - and up 0.3% from $138.49 last month
  • Monthly Median Sales Price: $227,800 versus $209,900 last year - up 8.5% - and up 1.2% from $225,000 last month
We can see that the jump in closed sales during August is compensated by weaker under contract and pending numbers at the start of September, just as we would expect for a long month, and exactly the opposite of what we saw in July. Again the implication is that the jump in August's sales volume has no real significance.
Inventory in the higher sales ranges has fallen sharply over the last 3 months, as it tends to do every year. This means remaining sellers have much less competition. So far this has not resulted in much improvement in sales prices because it takes a very long time for lower inventory to feed through into pricing. In addition it is usual for inventory to rise just as strongly between October and March so we do not think the luxury market has escaped its problems just yet. If we end up with more luxury inventory in April 2017 than we had on April 2016, then luxury home pricing is likely to continue its current weak trend.
We are seeing a little more inventory at the affordable end of the market in certain areas. If it continues this should have a moderating impact on the high appreciation rates we have been seeing below $200,000. Buyers should also see a mild reduction in the number of competing offers for the homes they want. However the effect is currently only weak and could possibly peter out quickly.
The mid-range continues to enjoy healthy supply and healthy demand plus volume increases far in excess of the low or high ends. I see little to concern us in the market between $200,000 and $500,000 at the moment and for the next few months.
The only major concern for a housing analyst over the medium term would be a major reduction in housing demand due to some form of deportation program for undocumented residents. Whether voluntary or compulsory, any major reduction in population that happens suddenly would have a very noticeable and serious impact on the housing market. The effect would be similar to a fatal epidemic (like the Spanish Flu of 1918) resulting in increased vacancies and loss of equity for investors and homeowners alike. For unaffected tenants the effects would be mostly positive of course, as rents would probably fall quite sharply. I would expect valuations at the lower end of the market to be hit the most if this event were to take place in 2017 or 2018. Whether or not it is likely to happen in that time scale, or at all, I am unable to judge.
Over the longer term I am concerned about the weakness of population numbers for people under 20. The huge increases in population counts for people 65 and over is not compensatory. Any economy will find it hard to grow with declining population numbers from one generation to the next. Just ask Japan how that works. Current fertility rate trends are very negative and not being helped by the spread of the Zika virus. The potential economic effects of Zika could be serious if it becomes widespread in Arizona, notably for tourism but also for the economy as a whole.
So we have some medium and longer term threats to watch out for, but in the short term the vast majority of our local housing market is looking unusually positive and stable.
Sourced from the Cromford Report

Wednesday, August 31, 2016

Some cities are pulling back...

Cromford Daily Observation - Ranking the major & secondary cities by their annual percentage change in annual median sales price (single family only) we find the following:
  1. Arizona City - up 17.3% to $100,000
  2. Apache Junction - up 13.3% to $169,900
  3. Tolleson - up 12.4% to $179,900
  4. Sun City - up 12.2% to $165,000
  5. Glendale - up 11.9% to $210,000
  6. Avondale - up 11.8% to 190,000
  7. Sun City West - up 11.7% to $210,000
  8. Surprise - up 11.4% to $215,000
  9. Buckeye - up 11.3% to $182.500
  10. El Mirage - up 10.9% to $152,000
  11. Laveen - up 10.8% to $195,000
  12. Anthem - up 10.4% to $289,900
  13. Phoenix - up 9.7% to $224,900
  14. Maricopa - up 9.3% to $165,000
  15. Mesa - up 9.0% to $223,000
  16. Queen Creek - up 8.8% to $199,900
  17. Tempe - up 7.9% to $263,250
  18. Litchfield Park - up 7.8% to $275,000
  19. Goodyear - up 7.0% to $245,995
  20. Casa Grande - up 6.7% to $159,000
  21. Cave Creek - up 6.3% to $425,000
  22. Peoria - up 5.7% to $255,000
  23. Scottsdale - up 4.8% to $492.500
  24. Gilbert - up 4.6% to $275,000
  25. Chandler - up 4.6% to $277,250
  26. Fountain Hills - up 3.3% to $428,500
  27. Gold Canyon - up 2.4% to $255,950
  28. Sun Lakes - up 1.4% to $255,400
  29. Paradise Valley - up 0.9% to $1,437,500
The Cromford® Market Indexes for the single family markets in the largest 17 cities confirm we are still in a favorable situation for sellers:


Only 4 of the 17 cities showed any deterioration and the major decline was in Avondale, which could stand some cooling down after what seems like an eternity at the top of our table.
Perhaps the biggest surprise is the strengthening of Paradise Valley which is no longer at the bottom of the table thanks to an expected big decline in supply and an unexpected improvement in demand.
Tempe is probably another surprise, now at the bottom of our table thanks to its supply index rising to its highest level since 2014.
Overall this is a positive picture for sellers with 15 cities in a seller's market and 2 in the balanced zone between 90 and 110.

Friday, August 26, 2016

AZ Real Estate Demographic Shift - Crucial Developments

Cromford Daily Observation(s) - The demographic situation in the 15 Arizona counties is as follows:
CountyMedian Age July 2010Median Age July 20155 Year Change in Population Under 55 Year Change in Population of 65 and Over
Apache32.534.2-9.2%+19.7%
Cochise39.640.8-5.1%+14.6%
Coconino30.930.9-8.0%+32.1%
Gila47.949.7-2.7%+17.4%
Graham31.732.6-7.3%+12.4%
Greenlee34.933.6+4.6%+10.7%
La Paz54.055.4-9.6%+11.7%
Maricopa34.736.1-3.0%+27.0%
Mohave47.850.4-15.7%+20.6%
Navajo34.736.5-10.9%+24.2%
Pima37.738.4-4.7%+21.8%
Pinal35.438.7-21.1%+46.9%
Santa Cruz35.637.1-11.8%+22.2%
Yavapai49.452.6-12.2%+26.0%
Yuma33.734.6+0.9%+19.3%
The 21% decline in under 5s in Pinal County is very ominous for the elementary schools in that county, representing a 6,297 reduction from 29,882 in 2010 to 23,585 in 2015. At the same time the growth in retirees is phenomenal, with 47% more people at 65 plus and 60% more at 85 plus. Pinal county has shown a huge swing from young to old with a 3.3 year increase in the median age over just 5 years. This is due to a combination of growing 55+ active adult communities attracting people from far afield and a low fertility rate for the existing population.
Retirees are already dominant in Gila, Yavapai and especially La Paz counties.
A third of the counties lost population overall, which is a negative sign for their housing markets. These are:
  1. Cochise -4.1%
  2. Santa Cruz -2.0%
  3. La Paz -1.4%
  4. Gila -0.7%
  5. Apache -0.1%
This shift towards an aging population is not a small, insignificant change. It is a dramatic change compared with Arizona's experience prior to 2007. A lot of this change is probably caused by the unusually low immigration rates we have seen since 2007. In the distant past immigrant parents have tended to have larger families than native born parents and so contributed disproportionately to growing Arizona's economy. Retirees contribute relatively little to growing the local economy as they are usually not fertile and not working.
...we humans seem to have largely ignored the potential deceleration in our economy that low fertility rates are likely to create.
The fraction of the United States population age 60 or over will increase by 21 percent between 2010 and 2020, according to an academic study published in 2014 by the Rand Corporation. Between 2010 and 2050 the fraction will grow by 39%. Coupled with the historically large reduction in fertility rates that is currently underway, we are witnessing huge changes in the demography of the nation. These demographic changes are likely to have detrimental effects on the economy and sectors of the housing market may be significantly affected going forward.
We already see explosive growth in Arizona population counts for people over 60 while the population under 18 is barely growing (and under 5 is in decline). This is unexpected given that we have a relatively large number of women of child bearing age. It is generally accepted that people tend to consume more than they earn during their later years, but consume less than they earn while they are in their working years. It is very possible that the shift towards an older population is the primary cause of the relatively slow growth in GDP in the USA. It follows that similar effects are likely to be at work in other developed countries. We have not experienced an era like this before, so there is little experience to draw on just yet. However, I believe the rapidly changing demographics are likely to become the most significant factor driving housing demand over the next ten to fifteen years.

Thursday, August 11, 2016

How far is your house from the top?

Are we in a bubble? Should I sell?  Should I buy?  All valid questions.  The frustrating response that usually has to be given is..."it depends".  If you'd like more specific information please reach out.
The below information is how far off specific zip codes are from their peak pricing before the crash.
Cromford Daily Observation - For the Southeast Valley, the percentage below the peak in $/SF pricing for single family homes is as follows:
  1. Tempe 85282 -15%
  2. Chandler 85286 -15%
  3. Tempe 85281 -16%
  4. Tempe 85283 -16%
  5. Chandler 85224 -18%
  6. Mesa 85210 -18%
  7. Mesa 85202 -18%
  8. Chandler 85226 -19%
  9. Tempe 85284 -20%
  10. Chandler 85225 -21%
  11. Mesa 85204 -21%
  12. Mesa 85203 -21%
  13. Mesa 85205 -21%
  14. Mesa 85206 -22%
  15. Gilbert 85233 -22%
  16. Phoenix 85044 -22%
  17. Gilbert 85234 -23%
  18. Gilbert 85297 -23%
  19. Chandler 85249 -23%
  20. Sun Lakes 85248 -24%
  21. Mesa 85209 -24%
  22. Mesa 85208 -24%
  23. Phoenix 85048 -25%
  24. Mesa 85212 -25%
  25. Mesa 85207 -25%
  26. Gilbert 85296 -25%
  27. Mesa 85201 -26%
  28. Mesa 85213 -27%
  29. Gilbert 85295 -27%
  30. Gilbert 85298 -27%
  31. Mesa 85215 -29%
  32. Phoenix 85045 -32%
Generally we can see that Tempe has recovered closest to its peak while Ahwatukee has the furthest to go, especially as we travel west..
Northeast Valley, here is how far single family pricing is below the peak of 8-10 years ago:
  1. Scottsdale 85251 -2%
  2. Scottsdale 85257 -8%
  3. Scottsdale 85250 -15%
  4. Scottsdale 85255 -15%
  5. Scottsdale 85258 -20%
  6. Scottsdale 85254 -21%
  7. Scottsdale 85260 -24%
  8. Fountain Hills 85268 -26%
  9. Carefree 85377 -26%
  10. Cave Creek 85331 -27%
  11. Scottsdale 85259 -27%
  12. Scottsdale 85262 -28%
  13. Paradise Valley -29%
  14. Scottsdale 85266 -31%
  15. Rio Verde 85263 -36%
South Scottsdale and Old Town Scottsdale are clearly the top performers in this group and beat any area from the West Valley or Central & North Valley that we examined over the last 2 days.
Central & North Valley, here are how far below the peak we are in the various ZIP codes (single family homes only):
  1. Phoenix 85018 -12%
  2. Phoenix 85013 -12%
  3. Phoenix 85014 -13%
  4. Phoenix 85006 -14%
  5. Phoenix 85015 -18%
  6. Phoenix 85003 -18%
  7. Phoenix 85021 -18%
  8. Phoenix 85008 -19%
  9. Phoenix 85020 -20%
  10. Phoenix 85007 -20%
  11. Phoenix 85028 -21%
  12. Phoenix 85032 -21%
  13. Phoenix 85054 -21%
  14. Phoenix 85024 -23%
  15. Phoenix 85050 -23%
  16. Phoenix 85027 -24%
  17. Phoenix 85012 -24%
  18. Phoenix 85022 -24%
  19. Phoenix 85023 -25%
  20. Phoenix 85016 -25%
  21. Phoenix 85053 -26%
  22. Phoenix 85085 -26%
  23. Phoenix 85029 -26%
  24. Phoenix 85042 -27%
  25. Phoenix 85083 -29%
  26. Anthem 85086 -29%
  27. Phoenix 85051 -30%
  28. Phoenix 85019 -32%
  29. New River 85087 -33%
  30. Phoenix 85031 -34%
  31. Phoenix 85017 -35%
  32. Phoenix 85033 -35%
  33. Phoenix 85041 -35%
  34. Phoenix 85043 -36%
  35. Phoenix 85004 -37%
  36. Phoenix 85037 -37%
  37. Phoenix 85040 -37%
  38. Phoenix 85035 -38%
  39. Phoenix 85009 -39%
  40. Phoenix 85034 -62%
Phoenix 85018 is helped by the popularity of Arcadia.
The percentage in the table below is comparing the current average $/SF for single family homes in the West Valley with the peak for that same ZIP code in the mid 2000's:
  1. Sun City West -21%
  2. Surprise 85374 -25%
  3. Glendale 85308 -25%
  4. Glendale 85306 -25%
  5. Avondale 85392 -26%
  6. Glendale 85304 -26%
  7. Peoria 85382 -26%
  8. Sun City 85373 -26%
  9. Sun City 85351 -26%
  10. Peoria 85381 -27%
  11. Glendale 85310 -27%
  12. Glendale 85302 -27%
  13. Peoria 86383 -28%
  14. Surprise 85378 -29%
  15. Peoria 85351 -29%
  16. Surprise 85387 -31%
  17. Litchfield Park 85340 -31%
  18. Wittmann 85361 -31%
  19. Surprise 85388 - 32%
  20. Surprise 85379 -32%
  21. Glendale 85303 -32%
  22. Glendale 85301 -32%
  23. Tonopah 85354 -32%
  24. Glendale 85305 -33%
  25. Wickenburg 85390 -35%
  26. Goodyear 85338 -35%
  27. Youngtown 85363 -36%
  28. Tolleson 85353 -36%
  29. Laveen 85339 -36%
  30. Avondale 85323 -37%
  31. Glendale 85301 -37%
  32. Buckeye 85396 -38%
  33. El Mirage 85335 -38%
  34. Buckeye 85326 -41%
  35. Goodyear 85395 -45%
  36. Waddell 85355 -49%

Wednesday, August 3, 2016

August 1st Market Update...read if you want to fall asleep : )

Market Summary for the Beginning of August
The market conditions improved a little for sellers once again during July, with the Cromford® Market Index breaking through the 145 level with some momentum as we enter August. However there is still no dramatic new trend showing up, just a continuation of those we have been seeing for several months now. Sales momentum was actually stronger than it appears from the numbers posted during July. With a weekend at either end of the month we had only 20 working days to get deeds recorded compared with 22 in July 2015. Many people are surprised that the number of working days in a month makes a big difference, but after 14 years of measuring I can assure you it definitely does. In any case it is normal for July to be much quieter for closings than June. This is a seasonal pattern that is seen every year.
Here are the basic ARMLS numbers for August 1, 2016 relative to August 1, 2015 for all areas & types:
  • Active Listings (excluding UCB): 19,711 versus 19,459 last year - up 1.3% - but down 3.7% from 20,458 last month
  • Active Listings (including UCB): 23,801 versus 22,837 last year - up 4.2% - but down 4.2% compared with 24,856 last month
  • Pending Listings: 6,824 versus 6,327 last year - up 7.6% - but down 2.5% from 6,985 last month
  • Under Contract Listings (including Pending & UCB): 10,897 versus 9,705 last year - up 12.3% - but down 4.3% from 11,383 last month
  • Monthly Sales: 7,776 versus 8,046 last year - down 3.4% - and down 13.2% from 8,860 last month
  • Monthly Average Sales Price per Sq. Ft.: $138.22 versus $132.79 last year - up 4.1% - and down 2.0% from $141.03 last month
  • Monthly Median Sales Price: $225,000 versus $211,000 last year - up 6.6% - but down 2.2% from $230,000 last month
We can see that the shortfall in closed sales during July is compensated by strong under contract and pending numbers at the start of August, just as we would expect for a short month.
Below $175,000 we see a large drop in sales volume compared with July 2015, caused by the weak supply. Unit sales were down 29% with the biggest percentage fall for homes priced between $100,000 and $125,000 (down 52%).
Between $175,000 and $300,000, sales were up 10% with $250,0000 to $275,000 growing the most at 21%
The range from $300,000 to $350,000 was just a tad weaker than last year, but between $350,000 and $600,000 we saw a 12% increase in sales compared to July 2015.
Between $600,000 and $2 million, sales were very weak compared with July 2015, down 17% from 346 to 286.However the market over $2 million rebounded with 26 sales compared with just 19 in July 2015.
We are now at the point where inventory hits its minimum level in most years. New listings are arriving only 3% faster than last year and we have seen quite a lot of cancellations, especially at the higher price points. We will be looking to see what sort of inventory growth we get between now and the next peak at the end of November.
Demand is currently holding up, some 5% higher than we would consider normal. However the market conditions are probably going to be determined by changes in the supply. How much and at what price points will the new listings arrive?
_____________________________
The 'rebound' in the $2M plus market is a nice surprise. If you have unsold high-end listings this might be cause to objectively review with your seller where you stand relative to the competition - rationale being not only a hint at an improving market but getting ahead of the competition that will come as the inventory increases seasonally in the fall.

Monday, July 18, 2016

Year or Year AZ Real Estate Trend...interesting find for the numbers dorks : )

Cromford Daily Observation- At this stage of the year it is becoming very noticeable that 2016 is remarkably similar to 2015 so far. In fact we have not seen 2 consecutive years so similar before. This is apparent when you compare the weekly charts for days inventory, dollar volume, months of supply, active list price per sq. ft., listing success rate, listings under contract, pending listings, and sales per month.
The weekly days inventory chart shows almost identical readings for 2015 and 2016 from week 22 to week 29 (now).


​_____________________________________
The main takeaway overall is a relatively stable, balanced market. Of course there is the whole 'trifurcated' dynamic - where most notably there has been disproportionately more listings than demand in the higher end. And then at the lower end just the opposite. The true 'balance' in supply & demand is mid-range. So chunking down we can draw plenty of submarket distinctions - whether by price range or location. But the 'chunked up' (30 thousand foot) view as shown above is not much year-over-year change / relative stability. 

Not a bad message in a geopolitical year of uncertainty.

Wednesday, June 15, 2016

Arizona Demographics - Impact on Real Estate

The Census Bureau Quickfacts table for Arizona has some interesting statistics.
The total population estimate for July 1, 2015 is stated to be 6,828,065. This is up 1.4 % from 6,731,484 on July 1, 2014, Although this represents a total of 96,581 added to Arizona's population in 12 months it is also a lower percentage rate than many would like to see. Population growth fuels the economy, especially the economy tied to housing. The population figure for April 1, 2010 (census count rather than estimate) is 6,392,307. We have therefore seen a growth of 435,758 in just over 5 years, or 6.8%. This is better than many other states but far below the rates of growth that Arizona experienced between 1945 and 2007.
The balance in the population has been shifting dramatically away from children and towards retirees. The percentage of the population by age group changed as follows between April 1, 2010 and July 1, 2014:
  • Persons under 5 years of age - down from 7.1% to 6.4% - a 10% fall in just over 4 years
  • Persons under 18 years of age - down from 25.5% to 24.1% - a fall of 5.5% in just over 4 years
  • Persons 65 years and over - up from 13.8% to 15.9% - a rise of over 15% in just over 4 years
So although we added 339,177 people between April 1, 2010 and July 1, 2014, we ended up with 23,039 fewer children under 5 and 7,751 fewer children under 18. At the same time we added 188,168 people aged 65 and over and158,760 people between 18 and 65.
We may be in danger of following in the footsteps of Japan with plummeting fertility rates and falling school head counts.
_________________________
Comment: The fact that countries need young, productive producers to fuel their economies is something you don't hear talked about that much about in our current political and security sensitive environment. But this need for 'workers' and in our world 'buyers' is a factor in government immigration policies around the globe.

This is detailed in an interesting book by Harry Dent - The Demographic Cliff - where he speaks to what's going on in Japan and other European nations soon to follow suit - the consequence of falling populations, and also helps explain the fall-off in commodity prices (deflation) that Mike Orr (Cromford Report) has also observed.

On the flip side, relative to housing, nationwide there is a housing shortage - as we're not building fast enough to keep up with the population growth. As the millenials continue to buy more homes this will become even more manifest and of course is evidenced locally in the lack of lower-end inventory and subsequent rapid appreciation in that market sector.

Lawrence Yun, NAR Chief Economists speaks to this in your most recent REALOR Magazine in his article 'If you build it, they will come',  where he notes that U.S. homes sales are trending at 5.07 million units per year (demand), yet their are only 1.88 million active listings - a 4.5-month supply.

The first highlighted number in the Cromford Daily Observation above (adding 188,168 people aged 65 and over) helps explain the downsizing we're witnessing in the luxury sector.

The second highlighted number (adding 158,760 people between 18 and 65) is at least on the plus side. 

I guess we need to encourage the millenials to both buy homes AND have babies. I have a son and daughter who have made contributions in the last 4 years, so we're doing our part:)

Friday, May 27, 2016

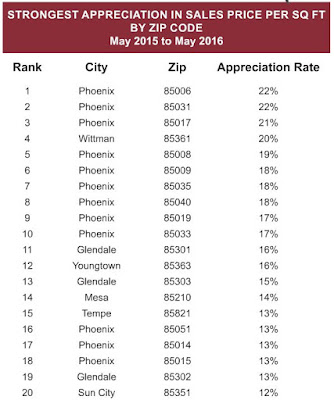
Year of Year Top Phoenix Zip Code Appreciation

These are some great numbers for the Central Phoenix neighborhood's.  Coronado Historic District is crushing it right now.  I predicted this almost 3 years ago in the 85006.  So much so that I put my money where my mouth was and bought 2 properties here.  I did underestimate the speed of the Garfield District resurgence though.  What a come back this neighborhood is seeing.  If you want to know where I see the next opportunity let me know : )  Again, I believe these trends to be so obvious I'm buying again this year.  If you spend enough time in the research, trends and numbers it's not speculation/risk...it can actually be fun : )


Monday, May 16, 2016

West Valley Real Estate Comback

Turning our attention to the West Valley single family market, we see even more contrast between the low and high end of the market.
  • Homes under $250,000 - average rise of 10.4% in $ per sq. ft. between Feb - Apr 2015 and Feb - Apr 2016
  • Homes between $250,000 and $500,000 - average rise of 1.2% in $ per sq. ft.
  • Homes over $500,000 - average fall of 5.0% in $ per sq. ft.
The fastest rising prices are to be found in:
  1. Glendale 85301 +22.5%
  2. Youngtown 85363 +18.8%
  3. Tolleson 85353 +15.7%
  4. Sun City 85351 +15.3%
  5. Glendale 85303 +14.1%
  6. Glendale 85302 +12.1%
  7. Buckeye 85326 +11.6%
  8. Peoria 85345 +11.3%
  9. Laveen 85339 +11.2%
The weakest places for appreciation are:
  1. Glendale 85310 -1.1%
  2. Peoria 85381 +0.9%
  3. Peoria 85383 +3.2%
  4. Surprise 85374 +3.8%
All other areas are over 5%

Friday, May 13, 2016

Good News for Valley Seller

This week the Cromford® Market Index table for the single family markets in the 17 largest cities is looking better for sellers everywhere except Cave Creek:


I admit that the change in Phoenix is also negative for sellers, but a change of less than 2% is hardly statistically significant. The West Valley is still improving fastest with most of the big movers located west of I-17:
  1. Buckeye +17%
  2. Peoria +8%
  3. Avondale +7%
  4. Goodyear +7%
Sellers in Paradise Valley and Fountain Hills get some relief at last from the discouraging trends of the past several month, and Queen Creek continues its improving trend.
__________________________

The CMI (Cromford Market Index) is an algorithm (formula) that tends to be an accurate short term market predictor. It essentially looks at the relative balance between supply and demand, though there's more that goes into it.
An index score of 100 = a relatively balanced market in terms of supply and demand.
Over 100 indicates demand exceeding supply, good for sellers.
Under 100 indicates supply exceeding demand, good for buyers. 
A green button shows the arrow trend is favoring sellers.
A red button shows the arrow trend is favoring buyers.
Keep in mind the obvious - the most favorable trends - where demand is exceeding supply, are in the low to mid range priced areas.
The higher-end areas, most specifically, the NE Valley, are generally not lacking in demand so much as having a year-over-year supply (new listings) exceeding demand (new contracts). 
The slightly improving trend in most of the NE Valley cities is the encouraging word.

Thursday, May 5, 2016

Your City Appreciation Update 5.5.2016

As appreciation rates have declined from the huge numbers (both negative and positive) during the disruptive period of 2003-2013, it has become more obvious that our usual method for calculating appreciation is less useful for smaller segments of the market. Our method has been to take the monthly average price per square foot and compare it with the same measurement one year earlier. This works quite well for the entire market but as you break the market into smaller segments, the volatility in their monthly average $/SF become excessive. Therefore we are changing our method to use the annual average $/SF instead of the monthly average to measure appreciation for all segments of the market. We will still use our original method for measuring the entire market (all areas & types).
Using the new method here is a ranking of the cities by appreciation rate, based on the 12 month change in their annual average $/SF for single family detached homes.
  1. Tonopah 27.0%
  2. Wittmann 19.7%
  3. Youngtown 16.3%
  4. Tolleson 10.8%
  5. Eloy 10.7%
  6. Sun City 10.5%
  7. El Mirage 9.8%
  8. Glendale 9.8%
  9. Avondale 8.7%
  10. Waddell 8.2%
  11. Laveen 8.1%
  12. Florence 7.8%
  13. Tempe 7.8%
  14. Buckeye 7.5%
  15. Arizona City 7.4%
  16. New River 7.4%
  17. Phoenix 7.3%
  18. Maricopa 7.2%
  19. Coolidge 7.1%
  20. Queen Creek 7.0%
  21. Mesa 6.6%
  22. Sun City West 6.4%
  23. Surprise 6.4%
  24. Apache Junction 6.3%
  25. Anthem 5.7%
  26. Chandler 5.5%
  27. Peoria 4.8%
  28. Gilbert 4.7%
  29. Desert Hills 4.7%
  30. Goodyear 4.4%
  31. Wickenburg 4.4%
  32. Litchfield Park 3.4%
  33. Sun Lakes 2.9%
  34. Casa Grande 1.6%
  35. Scottsdale 1.4%
  36. Carefree 1.3%
  37. Fountain Hills 0.5%
  38. Cave Creek -0.5%
  39. Rio Verde -0.5%
  40. Paradise Valley -0.7%
  41. Gold Canyon -3.9%
We note that 10 out of the top 11 cities are in the West Valley. The lone exception is Eloy, where prices are being helped a lot by new home sales in the Active Adult community Robson Ranch. Prices in Robson Ranch are much higher than the average home with a postal address in Eloy
6 out of the bottom 7 cities are in the Northeast Valley. In fact all of the northeastern cities are in the bottom 7. This underscores how badly the luxury market has been affected by excessive supply. If you were to remove all sales over $500,000 you would get a different picture of the Northeast Valley:
  1. Paradise Valley 26.1% (but only 3 sales a year were under $500,000)
  2. Carefree 8.5%
  3. Scottsdale 5.5%
  4. Fountain Hills 4.6%
  5. Cave Creek 1.0%
  6. Rio Verde 0.0%
We can disregard the Paradise Valley number since there is almost no market in PV under $500,000. The appreciation numbers for Carefree, Scottsdale and Fountain Hills are perfectly respectable for the market under $500,000. However Cave Creek & Rio Verde seem to be stuck in neutral even for the lower price ranges. Gold Canyon is also neutral at 0.3% if we exclude homes over $500,000, but as with Cave Creek & Rio Verde, neutral is better than the negative appreciation we see when we include all homes.
All the above numbers are based on ARMLS closings, not total recorded deeds.